


The Aggregate 🔬 December 30th, 2019
Hello! I am Lars E. Schonander, a writer for MediaFile and a blogger on international affairs, tech, and general wonkery. Happy Monday! Here is my weekly newsletter with a weekly analysis with interesting data, along with links related to things I found particularly interesting that week. Any Questions? Send me a message or just respond to this email!
The Weekly Data:
For work, one of the topics I am doing research on is why things like the New York City Subway System are not constructed as fast as they used to.
While looking for a dataset on the year each subway line was announced and finished construction, I discovered that the MTA has a weekly updated dataset on how many people enter and exist the turnstiles of all the subway stations in New York City.
One problem with the data is just how big it is. Each individual dataset has more then 200,000 rows (207605 rows for the dataset just for December 21st). To get a more data from a longer period, paralyzing the reading of the CSV files is important, considering that from 2015 on, their are 503 separate CSV files with more then 200,000 rows each.
For the sake of time, I downloaded about a months work of Turnstile data, so from around November 10th to December 20th. After filtering the data for any errors, it turned out to be 1,234,775 rows long.
A Station in a Month
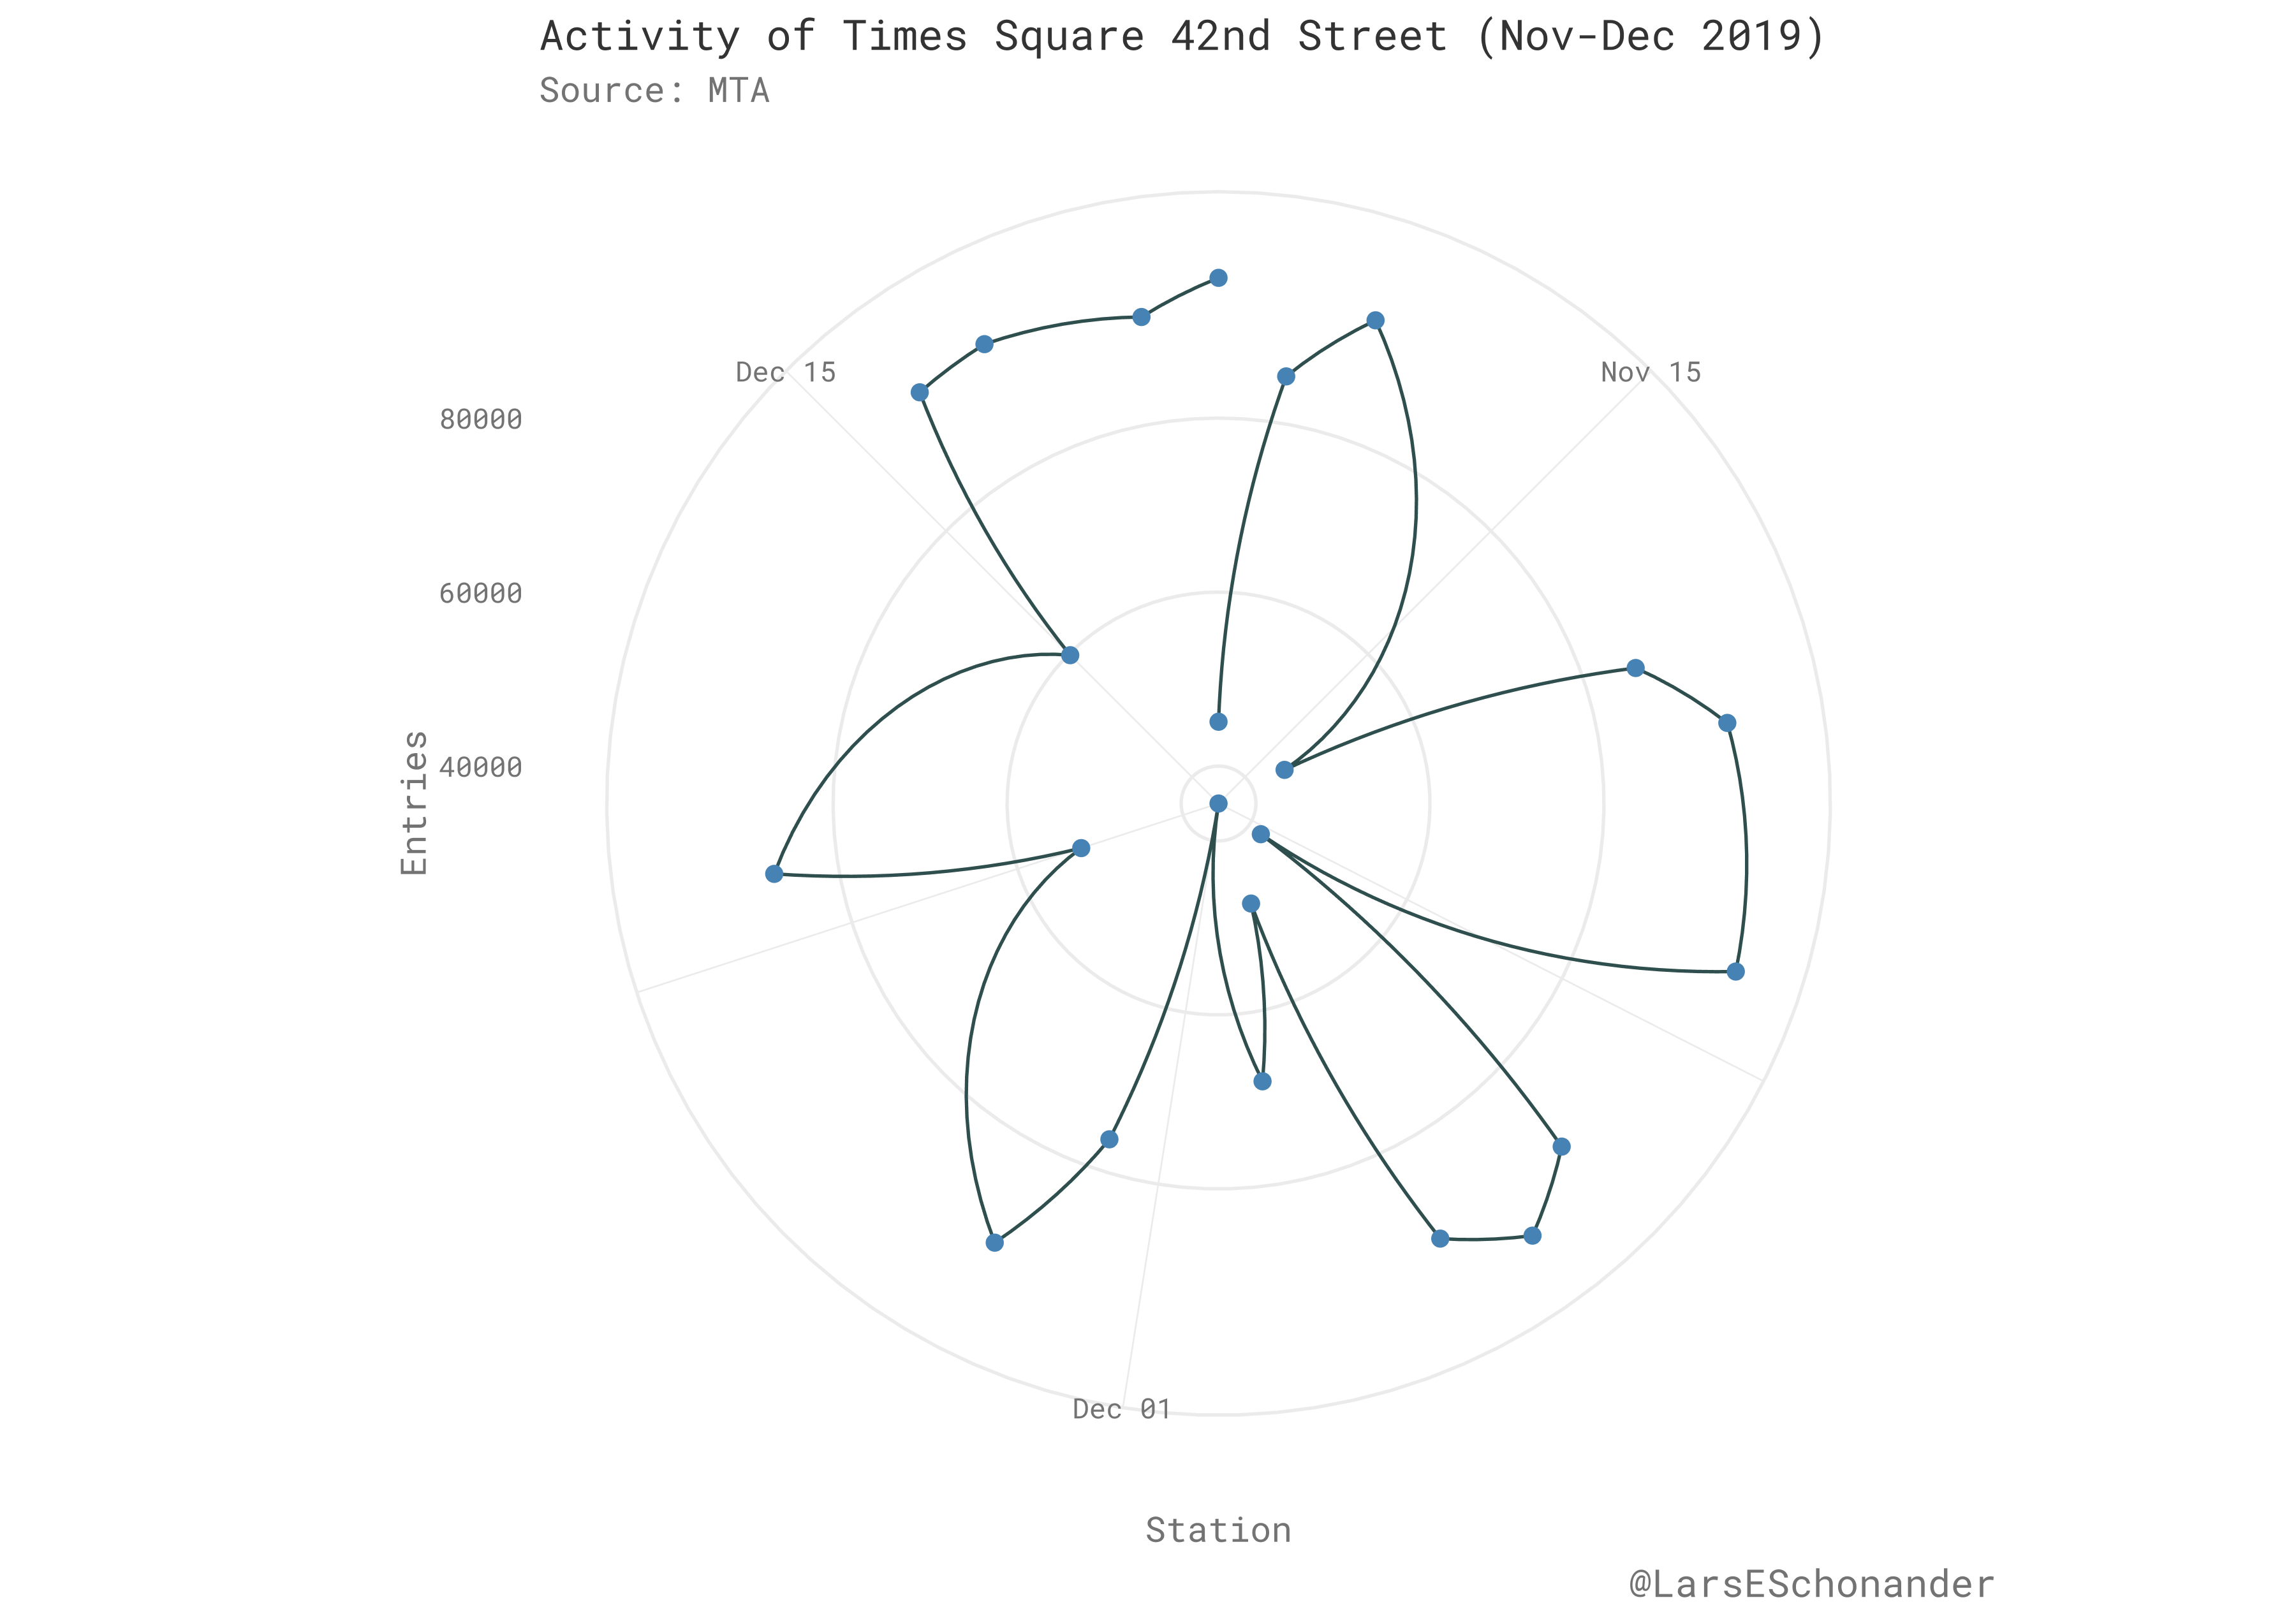
To begin, I simply wanted to look at the activity of a single station during the given period. Getting this data is relatively simple, one just filters by station name, and then summarizes the data per each day, so one gets the total entries per day.
As seen below, the activity of the station follows the expected pattern, it falls during the weekend as people are using the subway as they are not going to work. There is a noticeable dip around Dec 01 and before that, representing the fall in activity during the Thanksgiving season.
Station Popularity
I then wanted to compare the popularity of the most popular stations to the least popular ones. The most popular ones tend to be concentrated in midtown or around midtown, and tend to be used by commuters entering the city as well (Penn, 42 Pt-Auth). Interestingly, Grand Central is ranked lower then 34 St-Penn, meaning that more people commute from the city from New Jersey then from New York, but also Penn Station is a transit hub for other methods of transit then the train system, as Penn Station for example also services Long Island.
The stations that are the least popular are more dispersed then the former. For example, Morris Park is in the Bronx, and Rockaway while in New York, is in the Rockaways'. Several of these station like beach 105th street and Rockaway park B are on the parts of New York which are public beaches. While very unused right now, the amount of activity on these stations is likely higher in the summer.

Mapping the System Out
Using Google’s geoencoding API on the stop addresses, merging the lat-long points back in, then combining that data with the NYC neighborhood shapefiles, I got a rough approximation for total how many entries a given neighborhood had. Below is that from the 15th to 20th of December.

Now, some links…
Seraphine F. Maerz, Cornelius Puschmann (Springer): Text as Data for Conflict Research: A Literature Survey
Computer-aided text analysis (CATA) offers exciting new possibilities for conflict research that this contribution describes using a range of exemplary studies from a variety of disciplines including sociology, political science, communication studies, and computer science. The chapter synthesizes empirical research that investigates conflict in relation to text across different formats and genres. This includes both conflict as it is verbalized in the news media, in political speeches, and other public documents and conflict as it occurs in online spaces (social media platforms, forums) and that is largely confined to such spaces (e.g., flaming and trolling). Particular emphasis is placed on research that aims to find commonalities between online and offline conflict, and that systematically investigates the dynamics of group behavior. Both work using inductive computational procedures, such as topic modeling, and supervised machine learning approaches are assessed, as are more traditional forms of content analysis, such as dictionaries. Finally, cross-validation is highlighted as a crucial step in CATA, in order to make the method as useful as possible to scholars interested in enlisting text mining for conflict research.
Sean Illing (Vox): A decade of revolt
If there’s a word that sums up the past decade of politics, it might be “revolt.”
A revolt against elites. A revolt against liberal democracy. A revolt against the status quo. The seminal events of the 2010s felt like a collective “no” to the entire system.
In 2014, a book called The Revolt of the Public was published without much fanfare. The author was Martin Gurri, a former CIA analyst who spent most of his career studying politics and the global information landscape. The book has since become a favorite of Silicon Valley types as well as people interested in technology and politics (an updated edition was republished last year).
From our perch at the end of the decade, Gurri’s book reads like prophecy. He argued that the digital revolution would transform the information space and empower the public to participate more and more in politics. That empowerment would create an impulse to revolt against the dominant institutions of society — government, media, the academy, etc. — and the elites who run them.
William R. Emmons, Ana H. Kent and Lowell R. Ricketts (Saint Louis Fed): Is College Still Worth It? The New Calculus of Falling Returns
The college income premium—the extra income earned by a family headed by a college graduate over an otherwise similar family without a bachelor’s degree—remains positive but has declined for recent graduates. The college wealth premium (extra wealth) has declined more noticeably among all cohorts born after 1940. Among non-Hispanic white family heads born in the 1980s, the college wealth premium is at a historic low; among all other races and ethnicities, it is statistically indistinguishable from zero. Using variables available for the first time in the 2016 Survey of Consumer Finances, we find that controlling for the education of one’s parents reduces our estimates of college and postgraduate income and wealth premiums by 8 to 18 percent. Controlling also for measures of a respondent’s financial acumen—which may be partly innate—, our estimates of the value added by college and a postgraduate degree fall by 30 to 60 percent. Taken together, our results suggest that college and post-graduate education may be failing some recent graduates as a financial investment. We explore a variety of explanations and conclude that falling college wealth premiums may be due to the luck of when you were born, financial liberalization and the rising cost of higher education.
Urbit: Roadmap
Today, we call Urbit an ‘OS 0’. It’s an evolving open source project with a live network. In 2020, we’re planning to ship OS 1 — the first minimal but complete release of Urbit.
As we discussed in the last post, we see Urbit’s primary advantage as bringing together groups to share a set of modules for communication and collaboration. As Urbit matures, the set of available modules grows and expands, and the system both stabilizes and becomes more secure.
Let’s walk through the sequence of milestones we have planned for 2020 and 2021.
Andrew Stuttaford (New Criterion): The importance of being Ernst
Born in Heidelberg into a prosperous and clever family in 1895, Jünger evolved into “something . . . of a non-conformist.” He joined the Wandervogel, a back-to-nature movement containing elements of scouting and an early 1960s Newport Folk Festival, as well as glimpses of a darker atavism. Signing up in 1913 with the French Foreign Legion at a recruiting office in—history likes its jokes—Verdun was a bigger surprise; that Jünger deserted was even bigger still. He was caught, but his father secured his release. Jünger had escaped the French army. Within eighteen months, he would be fighting it.
What I’m Reading

I am still reading The Silk Roads by Peter Frankopan. One good thing Peter does is provide context to how the region was important in more modern periods, from the Great Game in the 19th Century to conflict caused by Persian oil reserves in the 20th.
At the start of this year I made a choice to make a change in pace in my reading habits. This lead to get into Chinese science fiction by reading works such as The Three Body Problem. The work I thought was the most interesting however was, The Waste Tide by Chen Qiufan, a story based on the electronic waste workers of southern China.
In 2020 I plan to keep up that same choice, but focus on a different geographic region. To start, I think I will read The Muqaddimah by Ibn Khaldun and Ibn Fadlan and the Land of Darkness: Arab Travellers in the Far North by Ibn Fadlan. I have always liked reading about the history of the Middle East plus Central Asia, but I realized I focused more on the Central Asia part, so a change in pace would likely provide fresh perspectives.
What I’m Working On
As an excuse to work with the R package Plumber, I plan to convert the MTA Turnstile page into a API. Instead of setting up a scraper, one can just filter by date instead to find the range of files one wants to the data for.
I have the API set up, just need to get it up somewhere like DigitalOcean.
Also, I discovered this dataset is like the famous NYC Taxi dataset, so I realize to analyze it for longer periods, I need better ways of storing it. This is why right now I am dumping the data into a PostgreSQL database as I write this.
Thanks!
Thanks for taking the time to read this, I will be back next Monday. In the meantime, you can follow me on Twitter or reach out via email.